This post will outline what I hope will be my final mapping project (more on hopes and hopes-potentially-dashed later).
I want to start with this chart, which I can point to as a major piece of inspiration behind this proposed project:
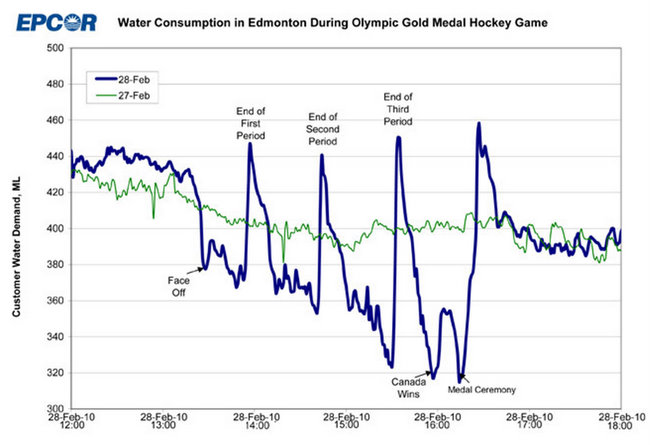
This graph shows water consumption in Edmonton, Canada, on February 27, 2010 (green line), and February 28, 2010 (blue). On Feb. 28, the Canadian National Hockey team competed for the gold medal in the olympics. Hockey has three periods during which play never stops, and a solid break in between each period. You can see that prior to and following the game, water consumption patterns are roughly analogous to those of the day before, but fluctuate wildly during the two-and-a-half hours surrounding gameplay and subsequent awards ceremony. So what’s happening here? A lot more people flush their toilets when each period of play ends and then stop going to the bathroom during play (and it must have been an exciting game, because water usage goes further and further down and really drops off toward the end. I just l0oked it up, and yes, it was a very exciting finish).
So what does this have to do with Urban Media Archaeology? What I find interesting about it is that you can look at something like water usage patterns and make inferences about other seemingly unrelated events happening concurrently (and further, you can make guesses as to peoples’ interests and motivations at the time). Who would have thought there were clear connections between hockey and water use?
So what I am interested in studying springs from this notion of one set of data giving insight into either another set of data, or into physical infrastructure systems, or even group behavior patterns.
My proposal is to map power and telecommunications demand through time in the New York City. Not only am I interested in things like the above chart, which would show how demand in certain places fluctuates on a given day, but also in how the electrical and communications infrastructure was first created and how it grew throughout the city. By charting the growth patterns of electrical and telecommunications infrastructure, as well as the demands placed upon these systems over time, one will be able to make hypotheses as to the nature of the surrounding cityscape. For example, one may assume that certain areas of the city, such as Wall Street, would have fairly regular power demands and fluctuations that correspond with the schedule of the trading floors; one can see the growth of a place like Times Square through its increased power demands over the past 60 years; one can chart, to a certain degree, the spread of affluency, especially in the first half of the 20th century, by charting the construction of power and phone lines.
Such potential to apply infrastructure and demand onto demographics or “events on the ground” seem to me to be endless, which brings me to the larger question of what exactly would be the point of my undertaking this endeavor? I think that some comprehensive overview of infrastructure and usage over time is important in itself, but where it really gains value is in its ability to be applied to other observations and other sets of data that lie outside of my direct area of concern. In short, it is in the URT setting that such a mapping project’s fruits can really be appreciated. Infrastructure growth patterns in themselves may not be readily interpretable until you become aware of some correlating event; if electricity demand suddenly increases over a number of years along, say, Eighth Avenue, the reason for this may not become apparent until you discover that those same years correspond to the construction of the IND train line (now the A train). This is analogous to how the above water usage patterns may not make sense until you know about the hockey game (and make even further sense once you understand the structure of a hockey game).
So my project hopes to create an alternate picture of how electricity and telecommunications infrastructure and demand both have shaped and are shaped by the infrastructure, economic activity, and demography of the surrounding city. This picture can then work in tandem with other maps and sets of data to help better understand patterns of growth and industry in the city. This is of importance at this present time, because in some ways, historical patterns of infrastructure growth and communication and electricity demand can inform present-day efforts to plan for future growth, and to better understand what happens to areas and populations that are either better or more poorly served than others. By better understanding the interplay between infrastructure, information and electricity demand, demographics, and development, individuals or entities such as city-planning agencies, electrical service providers, and infrastructure designers can be better equipped to serve the city and their customers’ future demands.
My research plan consists primarily of gaining access to the information that will form the bedrock of my project: maps diagramming the physical infrastructures that I am concerned with; and records indicating power consumption and telecommunications demand. While I am fairly confident that the former information exists and is accessible, I am less confident in my ability to access the latter material. I don’t doubt that it exists, but I am simply not sure that it is something that I would have access to, as much of it likely is in the possession of now-private energy providers. My concern with this potential roadblock also ignores for the moment the potential difficulty of compiling such an enormous amount of data, should I gain access to it. Beyond this collection of data, I intend to identify a number of points of interest that exist within the city, which can be illustrative of larger issues related to infrastructure or demand. I would propose producing some sort of brief “profile” of these places, likely in the form of videos or interviews with experts explaining a given location, device, or system. Examples would be an explanation of how electricity or phone lines enter the city from sources beyond its boundaries; or an interview with the person who reads electric meters in Times Square; or a historian who can give an overview of Edison’s original Pearl Street power station.
Much of the final form of my contribution to the URT map will depend upon both the access that I am able to secure to sources of data, as well as the feasibility of transforming what may be a very large amount of data into something comprehensible. Keeping these limiting factors in mind, it may become necessary to narrow down or refocus my research as the project develops.