“All perceiving is also thinking, all reasoning is also intuition, all observation is also invention.” – Rudolf Arnheim
Invincible Cities is a website including maps of two cities (Richmond, CA and Camden, NJ) and one neighborhood (Harlem, NY). It was built in collaboration with photographer Camilo Jose Vergara, Rutgers University historian Howard Gillette and Cory Clarke and Dean Di Simone of Interactive Design. In critiquing the Harlem, NY map on this site that was built to organize the work of photographer Vergara and imply his own ideologies of urban transformation, it is necessary to explore Vergara as a pedestrian of this territory. When Vergara “built Harlem,” he built a story of himself in Harlem. This map cannot be critiqued for its ability to show urbanization itself, but rather for its skill in presenting Vergara’s own version of urbanization.
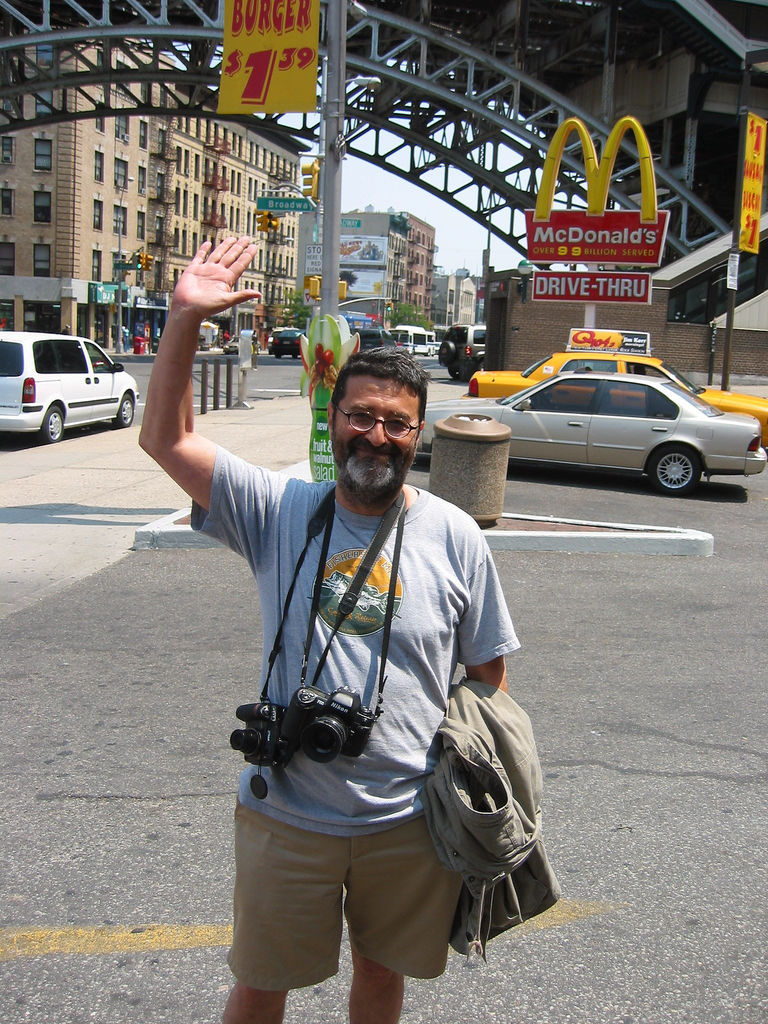
Vergara has been documenting changes in Harlem’s physical structures and space for over 37 years. He was a map builder before he became a map plotter. Even before he considered his photographic archive mappable, he described himself as “more of a city builder then a photographer” (12). He collected map plot points as photographs, his camera like binoculars in his self-defined role of a “ranger surveying the grounds of a vast park” (4), similar to James Corner’s notion of the exploratory mapper as a “nomadic grazer […] detouring around the obvious so as to engage what remains hidden” (225). Vergara acts as a perfect example of a builder of reality, his photographs acting as “bricks, which when placed next to each other give shape and meaning to a place” (12). This map-worthy juxtaposition of physical locations from 1977 until 2007 tell the story of Vergara’s work; an “urban morphology” (Knowles 7) that tracks a network of relationships between the physical space and itself throughout time.
From the comfort of an apartment in Brooklyn, I walk through Harlem from multiple different camera angles and time periods. There are several different entryways to the neighborhood within this map that can be observed with each other to create a multi-layered geohistoire, based on reimagined connections of time and space: (1) A slideable time scale allows me to adjust the map according to year, (2) an image key offers six different perspectives (e.g. interior, street view, panoramic) with which I can view the site, (3) a drop down menu most obviously displays Vergara’s personal ideology of urban decline and renewal, offering me the option of viewing thematically organized photographs (e.g. commerce, ruins, junkyard, Columbia expansion), (4) and several years appear below the photograph that I choose to click on from the right-hand column, if there are other photographs of the same site. The elements of time and space seem like a commonplace option in many thematic maps, however, the overtly political offering of a drop-down menu with specific forms of Harlem’s urban renewal and decline further unpack Vergara’s own thesis. It is a fascinating function that allows the viewer to choose a theme and explore related photographs or choose a photograph and observe the change (if there is any) of themes over time.

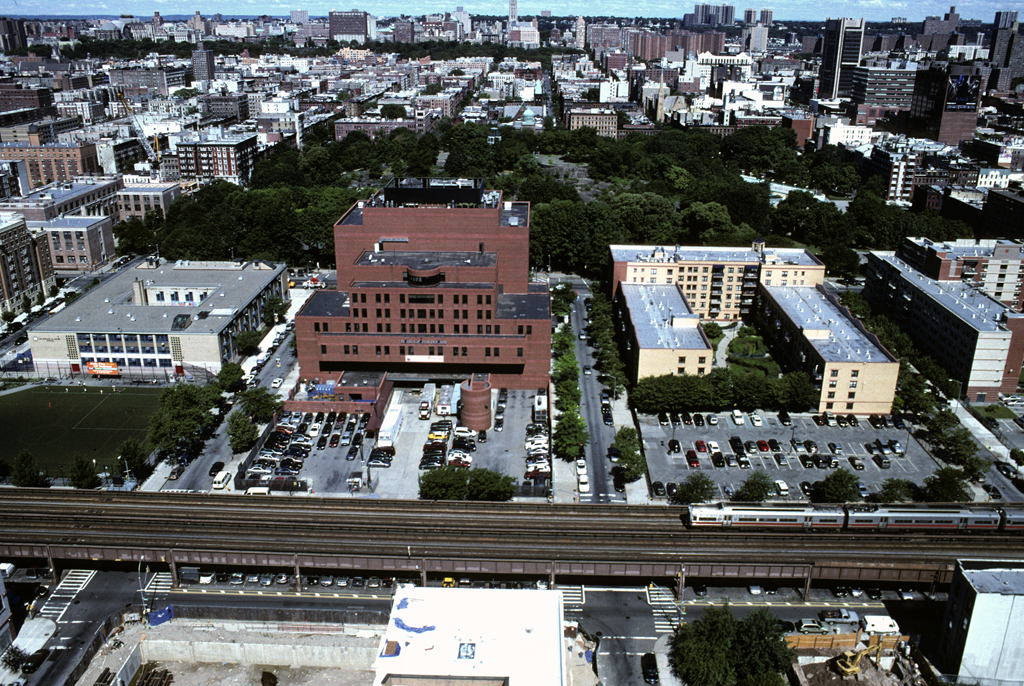
(Top) Lexington Avenue between 120th and 121st street (Bottom) Lexington Avenue between 120th and 121st street
(1990). Labeled Junkyard and Institution. (2007). Labeled Institution.
If a transparency were to show change using a slider (as in the slideable time scale), it would imply more flow and less inter-relationship happening between each point and itself throughout time. The switch from one photograph to the next as I click from year to year further underlines the abrupt change of the urban landscape throughout time.
In considering the hierarchy of information presented in the parimap and epimap, Invincible Cities seems to prioritize the display of the photographs and the narrative of the project itself. This makes sense, considering that the re-territorialization of Harlem in this depiction is completely based on one pedestrian photographer’s point of view. What he saw should be eye level with what we see when we look at the site. The small basemap graphics on the side of the screen are only superhuman perks to perusing a neighborhood on the internet versus in person. None of the street names or intersections are labeled in the basemap. The photographs (and light blue target box on the basemap) offer the dominant sources of navigation. Perhaps the mapmakers are emphasizing the importance of location in public life within time over exact location in space (Corner 226). There are several introductions to the work of Vergara throughout the site. Although the font is grey, small and difficult to read, (matching the small basemap motif) the introductions take up the entire screen and the option to return to the map itself is difficult. It almost seems like the design for a ‘what’s behind this door’ exhibit at a children’s museum. There is the beginning image that puzzles and confuses the viewer and then beneath the door (i.e. surrounding the basemap) there is an explanation of its context (i.e. the basemap). Finally, on the side wall there is the story of the exhibit itself – optional, separate and large viewing material at the entrance to the exhibit (i.e. the homepage).
Illustration of ‘what’s behind this door’ structure of museum display: Artifact, explanation, exhibit narrative
The main flaw in Invincible Cities is the lack of “online workspace” (Knowles 16). Where is the collaborative element in the building of Harlem, NY from the bottom up? Where is the “you, me and us” that characterize a neighborhood (according to Dennis Wood)? The grey box beneath the large photographs could allow for more obvious public discussion. Instead, the discussion (or lack thereof) is relegated to a tab lightly titled “Comments” and the grey box remains empty; tantalizing the viewer with the possibility of more documentation and story. Even Vergara himself admits that a major complaint of Invincible City users has been: “We don’t see our city in this way.” So, how do you reserve a space within the subsequent de-territorialization and re-territorialization by an ‘outsider artist,’ for the voices of the community members he represents? It is my argument that the creation of a map should be co-curated by the mapmaker and the population that he or she chooses to plot.
Illustration of an interactive approach to ‘what’s behind this door’ application: Artifact, collaborative explanation, exhibit narrative
As a prototype for my own project, this notion of co-curation would extend beyond the visual representation of crowdsourced data on maps such as OpenStreetMap and incorporate itself more directly into the creation of the map platform itself. In the children’s museum ‘what’s behind the door’ example, the explanation beneath the abstraction would be an interactive screen available for public use. In my own map on youth media, the youth themselves will be able to tell their stories as related to the artifacts – photographs, audio and video.
Corner, James. “The Agency of Mapping: Speculation, Critique and Invention” In Denis Cosgrove, Ed., Mappings(London: Reaktion, 1999): 231.
Fels, John and Denis Wood. Excerpts from “The Nature of Maps” In The Natures of Maps: Cartographic Constructions of the Natural World (Chicago: University of Chicago Press, 2008): 6-16.
Knowles, Kelly Ann. “GIS and History” In Anne Knowles, Ed., Placing History: How Maps, Spatial Data, and GIS are Changing Historical Scholarship (Redlands, CA: ESRI Press, 2008): 1-26.
Mattern, Shannon C. “Critiquing Maps.” Words in Space, August 29, 2010. http://www.wordsinspace.net/wordpress/2010/08/29/critiquing-maps/
Wood, Denis. “Everything Sings: Maps for Narrative Analysis.” 13 October 2011. places.designobserver.com/feature/everything-sings-maps-for-a-narrative-atlas/30358